gazetteer/series
Then vs Now: daily area series
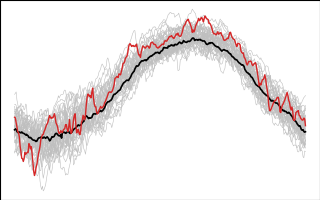
Daily statistics of each raster cube over its place polygon: one Parquet per (dataset, variable, place) for the full record (1985 to the archive's last day). This is what the day-of-year chart reads: a few hundred kB for 40 years, no raster reads. Published at https://storage.oceanmetrics.io/gazetteer/series/.
series/
  collection.json
  items/<dataset>_<variable>_<place>.json
dhw_5km/CRW_SST/NMS:FKNMS.parquet| column | type | |
|---|---|---|
date | DATE | UTC day |
mean | DOUBLE | area-weighted mean: each 0.05° cell weighted by the fraction of it inside the polygon |
mean_unwt | DOUBLE | unweighted mean over the cells touching the polygon |
sd, min, max | DOUBLE | over those cells (sd unweighted, ddof 1) |
n_cells | INT | cells with a value touching the polygon |
weight_sum | DOUBLE | sum of the coverage weights (polygon area in cell units) |
mean_shiny | DOUBLE | the climate-dashboard-app's own CSV value, for comparison |
place_id, dataset_id, variable | VARCHAR | so files union cleanly |
How mean is computed
The archive's CSVs only hold the old app's daily mean (lyr, mean, time; terra::zonal(exact = TRUE) over the climate-dashboard polygon), so every column here is recomputed from the year COGs over the gazetteer polygon in places.parquet: each cell's weight is the fraction of it covered by the polygon (rasterised on a 20 × 20 sub-grid per cell), the same coverage weighting as terra::zonal(exact = TRUE) and as mean_wt in the app's live stats/ (note: there mean is the unweighted one; here mean is weighted because it is the number to chart). No cos(latitude) factor, like terra. Against mean_shiny the recomputed mean agrees to ≤ 0.003 °C (r = 1.0000) for 11 places and ≤ 0.017 °C for GRNMS (6 cells); for CHNMS it differs by a median 0.12 °C (max 0.85, r = 0.997) because the old app averaged over the proposed Chumash boundary (CPNMS) and mean uses the designated one. Years that are all NaN in the source archive (see ../rasters/README.md) have no rows.
Read
-- day-of-year curves, every year, with a Then climatology and anomaly
WITH s AS (
  SELECT date, year(date) AS year, dayofyear(make_date(2000, month(date), day(date))) AS band, mean
  FROM read_parquet('https://storage.oceanmetrics.io/gazetteer/series/dhw_5km/CRW_SST/NMS:FKNMS.parquet'))
SELECT s.*, mean - avg(mean) FILTER (WHERE year BETWEEN 1985 AND 2005) OVER (PARTITION BY band) AS anom
FROM s ORDER BY year, band;
band here is the same band number as in the raster files. License CC-BY-4.0 (derived); built by catalog/build_then_now.py.
| name | size | modified |
|---|---|---|
| dhw_5km/ 13 | 7.8 MB | 2026-10-07 22:22Z |
| items/ 13 | 60.4 KB | 2026-10-07 22:22Z |
| AGENTS.md | 844 B | 2026-10-07 22:22Z |
| README.md | 2.8 KB | 2026-10-07 22:23Z |
| collection.json | 7.9 KB | 2026-10-07 22:22Z |
| series.thumb.png | 29.5 KB | 2026-10-07 22:22Z |