gazetteer/rasters
Then vs Now: daily rasters
One cloud-optimized GeoTIFF per (dataset, variable, place, year) with 366 bands, band i = day-of-year i of a leap-year calendar: band 1 is 1 Jan, band 60 is 29 Feb, band 61 is 1 Mar in every year. In a non-leap year band 60 is all NaN. A month-day is therefore the same band in every year file and in every climatology file, with no shifting. Published at https://storage.oceanmetrics.io/gazetteer/rasters/.
Currently: NOAA Coral Reef Watch CoralTemp daily SST (noaacrwsstDaily analysed_sst on NOAA CoastWatch ERDDAP, the product PacIOOS re-serves as dhw_5km CRW_SST, our erddap/dhw_5km), 1985 to the archive's last day (2026-10-04 at build time), for 13 sanctuaries.
Files
rasters/
  collection.json                                # summaries list dataset, variable, place ids, years
  items/<dataset>_<variable>_<place>_<year>.json  # one STAC Item per file (proj:, file:size, file:checksum)
  dhw_5km/CRW_SST/NMS:FKNMS/1985.tif ... 2026.tif
The place id keeps its colon in the object key (NMS:FKNMS/2020.tif), as in stats/.
Encoding
| CRS | EPSG:4326, 0.05° cells on the CRW grid (cell edges on multiples of 0.05°) |
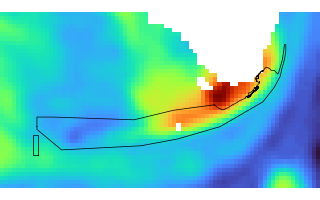
| extent | the sanctuary's bounding box buffered by 20 % of √area (the old climate-dashboard-app box), e.g. FKNMS 78 × 43 px |
| bands | 366, band description = ISO date (2020-07-18); --02-29 for band 60 of a non-leap year |
| dtype / nodata | float32, NaN (no data: land, or a day missing from the archive) |
| layout | COG, INTERLEAVE=BAND, 256 × 256 tiles, DEFLATE + floating-point predictor (3) |
| overviews | OVERVIEWS=AUTO, which makes none: every grid fits inside one 256 px tile |
| band tags | STATISTICS_MINIMUM/MAXIMUM/MEAN/STDDEV/VALID_PERCENT (nan and 0 for an empty band) |
| tags | SOURCE_URL, SOURCE_DATASET, SOURCE_VARIABLE, SOURCE_ARCHIVE, PROVENANCE, PROCESSING, FIRST_DATE, LAST_DATE, N_DAYS, UNITS |
The current year is partial (it ends at LAST_DATE, also the Item's end_datetime); the bands after it are NaN.
Reading one day in a browser
Because every band is its own single tile, one day for one place is one HTTP range request of ~6 kB (FKNMS SST: 410 B to 6.9 kB per band) after the header, which geotiff.js reads once per file: ~150 kB (FKNMS: 147 kB), the IFD with the 366 tile offsets plus the GDAL_METADATA tag holding the 366 band descriptions and per-band STATISTICS_*, which the Portolan profile requires to be embedded in the file. Switching the day re-reads one tile per file; keep the opened GeoTIFF objects.
import { fromUrl } from 'geotiff'
const base = 'https://storage.oceanmetrics.io/gazetteer/'
const tiff = await fromUrl(`${base}rasters/dhw_5km/CRW_SST/NMS:FKNMS/2024.tif`)
const img  = await tiff.getImage(0)
const band = 61                                      // 1 Mar (dayofyear of the date in 2000)
const [d]  = await img.readRasters({ samples: [band - 1] })   // Float32Array, row-major, north row first
const bbox = img.getBoundingBox()                    // [west, south, east, north] of the pixel edges
maplibre-cog-protocol reads only EPSG:3857 COGs and colours whole tiles, so it cannot address band d of these EPSG:4326 files; read with geotiff.js and draw the array (canvas image source or a custom layer).
A custom "Then"
The two prebuilt baselines (1985–2005, 2003–2012) are in climatology/. For any other range, read the same band from each year file and average per pixel, ignoring NaN:
const years = [1990, 1991, 1992, 1993, 1994]
const bands = await Promise.all(years.map(async (y) => {
  const img = await (await fromUrl(`${base}rasters/dhw_5km/CRW_SST/NMS:FKNMS/${y}.tif`)).getImage(0)
  return (await img.readRasters({ samples: [band - 1] }))[0]
}))
const n = bands[0].length, mean = new Float32Array(n)
for (let i = 0; i < n; i++) {
  let s = 0, k = 0
  for (const b of bands) if (!Number.isNaN(b[i])) { s += b[i]; k++ }
  mean[i] = k ? s / k : NaN
}
That is one header + one ~6 kB tile per year: a 20-year custom Then costs ~20 × 155 kB (≈ 3 MB) on first use and ~20 × 6 kB per further day; a prebuilt climatology costs one header + one tile. For 29 Feb only the leap years contribute.
Provenance
Converted by catalog/build_then_now.py from the archive of the NOAA ONMS climate-dashboard-app (process/erddap.qmd → extractr::ed_extract()), mbon:/share/data/noaa-onms/climate-dashboard-app/erddap_sst/<NMS>/<year>.tif: float64 → float32 (the source values carry two decimals), bands moved onto the 366-day calendar, and the transform snapped from its float32 noise (0.04999998°) to the exact 0.05° grid. Archive folder CPNMS (the proposed name) is NMS:CHNMS; MBNMS-david and MBNMS-main (sub-units) have no gazetteer place and are not published.
Gaps in the source archive
- Whole years that are all NaN in the old pipeline's output (its fetch failed; the CSV is all
NAtoo): MBNMS 2015; MNMS 1991, 1999, 2015; NMSAS 1991; OCNMS 1999; SBNMS 2005, 2010, 2019. The files exist (366 NaN bands) and their Items sayerddap-places:n_days_valid: 0; the climatologies simply have one year fewer there (see_n.tif). Re-running the old pipeline for those place-years onmbonand thenbuild_then_now.py --codes <NMS> --years <y> <y>(plus--steps climatology,series,stacfor the place) would fill them. - TBNMS (Thunder Bay, Lake Huron) is not published: CRW CoralTemp has no SST over the Great Lakes, so its archive is all NaN (bar a spurious 0 on 2022-12-01).
License: CC-BY-4.0 for these derived files; the CRW data are NOAA, public domain.
| name | size | modified |
|---|---|---|
| dhw_5km/ 546 | 953.2 MB | 2026-10-07 22:21Z |
| items/ 546 | 1.7 MB | 2026-10-07 22:22Z |
| AGENTS.md | 1.2 KB | 2026-10-07 22:19Z |
| README.md | 5.7 KB | 2026-10-07 22:23Z |
| collection.json | 101.1 KB | 2026-10-07 22:19Z |
| rasters.thumb.png | 13.4 KB | 2026-10-07 22:22Z |