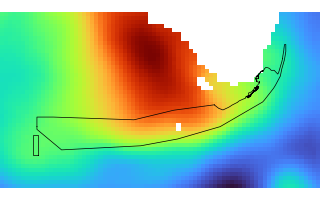
gazetteer/climatology
Then vs Now: day-of-year climatologies
Per-pixel day-of-year statistics of the rasters over a baseline period, one set of three 366-band COGs per (dataset, variable, place, baseline). Published at https://storage.oceanmetrics.io/gazetteer/climatology/.
climatology/
  collection.json
  items/<dataset>_<variable>_<place>_<y0>-<y1>.json      # one Item, assets mean / sd / n
  dhw_5km/CRW_SST/NMS:FKNMS/1985-2005_mean.tif           # float32, NaN nodata
  dhw_5km/CRW_SST/NMS:FKNMS/1985-2005_sd.tif             # float32 sample sd (ddof = 1), NaN when n < 2
  dhw_5km/CRW_SST/NMS:FKNMS/1985-2005_n.tif              # uint8 years with a value, no nodata (0 = none)
  dhw_5km/CRW_SST/NMS:FKNMS/2003-2012_{mean,sd,n}.tif
Baselines (erddap-places:baseline = [y0, y1] on each Item):
- 1985–2005: the climate-dashboard-app's default "first 20 years" (it is 21 calendar years, 1985 through 2005 inclusive, as the app's slider used it).
- 2003–2012: the NMS EcoIndicators baseline.
Band i is day-of-year i of a leap-year calendar, exactly as in the year files, so the Then band for a Now date is the same band number. Band 60 (29 Feb) is computed from the leap years only (n ≈ a quarter of the others); band descriptions are --MM-DD.
No smoothing. Each band is the raw mean of that calendar day over the baseline years (n ≤ 21 or 10 values per pixel), so the curve is noisy at day scale; smooth in the client if wanted (the app's moving-average slider). catalog/build_then_now.py --window N can instead pool ±N days per band (erddap-places:window_days on the Item and the WINDOW_DAYS tag record it; the published files use 0).
Same grid, encoding and reading pattern as the rasters (EPSG:4326, 0.05°, INTERLEAVE=BAND, 256 px tiles, DEFLATE, no overviews): a band is one range request of a few kB.
const img  = await (await fromUrl(`${base}climatology/dhw_5km/CRW_SST/NMS:FKNMS/1985-2005_mean.tif`)).getImage(0)
const then = (await img.readRasters({ samples: [band - 1] }))[0]
// anomaly = now[i] - then[i]; a z-score uses the matching _sd.tif band
For a baseline not listed here, average the year files: see "A custom Then" in ../rasters/README.md.
License: CC-BY-4.0 (derived); CRW data NOAA, public domain. Built by catalog/build_then_now.py.
| name | size | modified |
|---|---|---|
| dhw_5km/ 78 | 141 MB | 2026-10-07 22:22Z |
| items/ 26 | 160 KB | 2026-10-07 22:22Z |
| AGENTS.md | 787 B | 2026-10-07 22:22Z |
| README.md | 2.3 KB | 2026-10-07 22:22Z |
| climatology.thumb.png | 13.2 KB | 2026-10-07 22:22Z |
| collection.json | 9.1 KB | 2026-10-07 22:22Z |